Linux应用调试方法---Debug
常用的Linux应用调试方法:GDB
strace
用法:
1 | strace ./a.out |
gdb
core dump
查看core设置
1 | ulimit -a |
1 | core file size (blocks, -c) 0 |
开启core file
1 | ulimit -c unlimited |
示例
ubuntu18.04 64bit
- 异常程序(段错误)
1 |
|
- 编译*
1
gcc -g test.c
运行异常程序后,生成core文件
使用gdb查看异常位置
1 | gdb ./a.out core |
1 | GNU gdb (Ubuntu 8.1-0ubuntu3) 8.1.0.20180409-git |
ARM平台
本地编译支持arm平台的gdb
1 | !/bin/bash |
交叉编译
目标平台直接使用gdb调试
gdb调试
1 | gdb ./a,out |
- 动态的改变你程序的执行环境
启动调试
| 启动方式 | 说明 |
|---|---|
$gdb | 直接进去交互模式 |
$gdb -tui | 启动可以直接将屏幕分成两个部分,上面显示源代码,上下方向键可以查看源代码,想要命令行使用上下键就用Ctrl+n和Ctrl+p |
$gdb app | 启动gdb调试指定程序app |
$gdb <program> <PID> | |
$gdb <PID> | file命令指明可执行文件就可以显示源代码 |
调试交互
以下所有命令可以在调试时,使用
Tab进行补全
| 命令 | 别名 | 说明 |
|---|---|---|
help | 显示帮助信息 | |
file app | 载入指定的程序,编译app的时候要加入-g调试选项 | |
list n1 n2 | l | 列出指定区域(n1到n2之间)的代码详见list |
start | 开始执行程序,在main函数的第一条语句前面停下来 | |
run | r | 重新运行调试的程序, 它后面可以跟随发给该程序的任何参数,包括标准输入和标准输出说明符(<和> )和shell通配符(*、?、[、])在内 |
continue | 继续运行程序直接运行到下一个断点 | |
next | n | 执行下一步(执行一行代码,如果是函数也会跳过函数) |
next N | n N | 执行N次下一步 |
step | 单步进入(执行一行代码,如果遇到函数进入函数的内部,再一行一行的执行) | |
finish | 执行完当前函数返回到调用它的函数 | |
until | u | 指定程序直到退出当前循环体 |
jump 5 | j 5 | 跳转执行程序到第5行 |
return | 强制返回当前函数 | |
call <expr> | 强制调用函数, 如果函数的返回类型是void那么就不会打印函数的返回值 | |
print <expr> | 强制调用函数, 如果函数的返回值是void那么call不会打印返回值 | |
break 6 | b 6 | 在当前的文件中某一行(假设为6)设定断点 |
break 46 if testsize==100 | 设置条件断点(如果testsize==100就在46行处断点) | |
watch <expr> | ||
watch i != 10 | 检测表达式变化则停住,i != 10这个表达式一旦变化,则停住 | |
break func | b func | 在当前的文件中为某一函数(假设为func)处设定断点 |
break fileName:N | b fileName:N | 给指定文件(fileName)的某个行(N)处设置断点 |
info breakpoints | info break | 显示当前gdb断点信息 |
print var | print显示变量(var)值详见print | |
set var name=v | 设置变量的值 | |
delete N | 删除N号断点 | |
delete | 删除所有断点 | |
clear N | 清除行N上面的所有断点 | |
clear | 清除所有断点 | |
backtrace | bt | 显示当前调用函数堆栈中的函数 |
frame | f | 查看栈帧 |
set args no | 修改发送给程序的参数 | |
show args | 显示缺省的参数列表 | |
show language | 查看当前调试程序的语言环境,默认是c语言 | |
info function | 查看当前函数的程序语言 | |
set language c++ | 手动设置当前的程序语言为c++ | |
set language | 查看可以设置的程序语言 | |
kill | 终止一个正在调试的程序 | |
whatis var | 显示一个变量var的类型 | |
ptype var | 以更详细的方式显示变量var的类型, 会打印出var的结构定义 | |
info source | 显示当前的调试源文件 | |
info locals | i locals | 查看当前程序栈的局部变量 |
info registers | 查看当前寄存器的值(不包括浮点寄存器) | |
info all-registers | 查看当前寄存器的值,包括浮点寄存器 | |
info frame | 查看当前程序栈的信息 | |
x/10x $sp | 查看当前程序栈的内容 | |
display | 跟踪查看某个变量,每次停下来都显示它的值 | |
[Enter] | 直接回车,执行上一步命令 | |
quit | q | 退出gdb环境 |
list
list默认显示当前行和之后的10行,再执行又下滚10行
list后可以使用不同参数:
<linenum>: 行号<+offset>: 当前行号的正偏移量<-offset>: 当前行号的负偏移量<filename:linenum>: 哪个文件的哪一行<function>: 函数名<filename:function>: 哪个文件中的哪个函数<*address>: 程序运行时的语句在内存中的地址
print有打印显示变量(数组、结构体)与修改运行时变量的功能
print /x var: 用16进制显示(var)值print可以指定显示的格式,这里用’/x’表示16进制的格式
x: 按十六进制格式显示变量。d: 按十进制格式显示变量。u: 按十六进制格式显示无符号整型。o: 按八进制格式显示变量。t: 按二进制格式显示变量。a: 按十六进制格式显示变量。c: 按字符格式显示变量。f: 按浮点数格式显示变量。
使用打印功能时:var可以是变量、数组、结构体
1 | (gdb) print aa //数组 |
打印内存地址
x[/n] <address>打印内存地址的值,n表示后面连续n个地址的值
1 | (gdb) x/10 0x7ffffffee3c8 |
图形化gdb调试
cgdb
cgdb是GNU调试器(GDB)的轻量级curses(基于终端)接口。 除了标准的gdb控制台之外,cgdb还提供了一个分屏视图,可以在执行时显示源代码。
官网: http://cgdb.github.io

cgdb分为上下两栏,上面类似于vi窗口显示对应的代码,下面gdb窗口进行命令调试操作
操作
| 命令 | 说明 |
|---|---|
ESC | 输入焦点进入VI窗口 |
i | 输入焦点进入gdb控制台 |
VI窗口
调试快捷键
| 功能键 | 作用 |
|---|---|
F5 | Send a run command to GDB |
F6 | Send a continue command to GDB |
F7 | Send a finish command to GDB |
F8 | Send a next command to GDB |
F10 | Send a step command to GDB |
控制台
进入控制台使用方法与gdb一样
PS
查看线程CPU占用率
1 | ps H -eo user,pid,ppid,%cpu,cmd --sort=%cpu |
VScode
gdb的图形化调试,方便

常用插件
| 插件 | 作用 |
|---|---|
| c-cpp-project-generator | 直接生成项目文件 |
| Chinese (Simplified) | 汉化 |
| CMake Tools | cmake |
| Code Runner | 结合WSL编译调试 |
同步配置插件Settings Sync
1 | CODE SETTINGS SYNC UPLOAD SUMMARY |
编译
配置文件:task.json
1 | { |
调试
配置文件:lanuch.json
1 | { |
program: 需要调试的程序(必须为完整程序路径,可以使用VSCode的环境变量)args: 启动时传递给程序的命令行参数的JSON数据。例如: [“arg1”, “arg2].stopAtEntry: 是否停在程序入口点(停在main函数开始)cwd: 设置调试器启动的应用程序的工作目录。environment: 针对调试的程序,要添加到环境中的环境变量. 例如: [ { “name”: “squid”, “value”: “clam” } ]。MIMode:指定连接的调试器,只可以为gdb或lldbmiDebuggerPath: 指定gdb路径
问题
设置断点失效
检查编译时,是否添加
-g选项
Win10使用WSL
安装插件Code Runner
launch.json
1 | { |
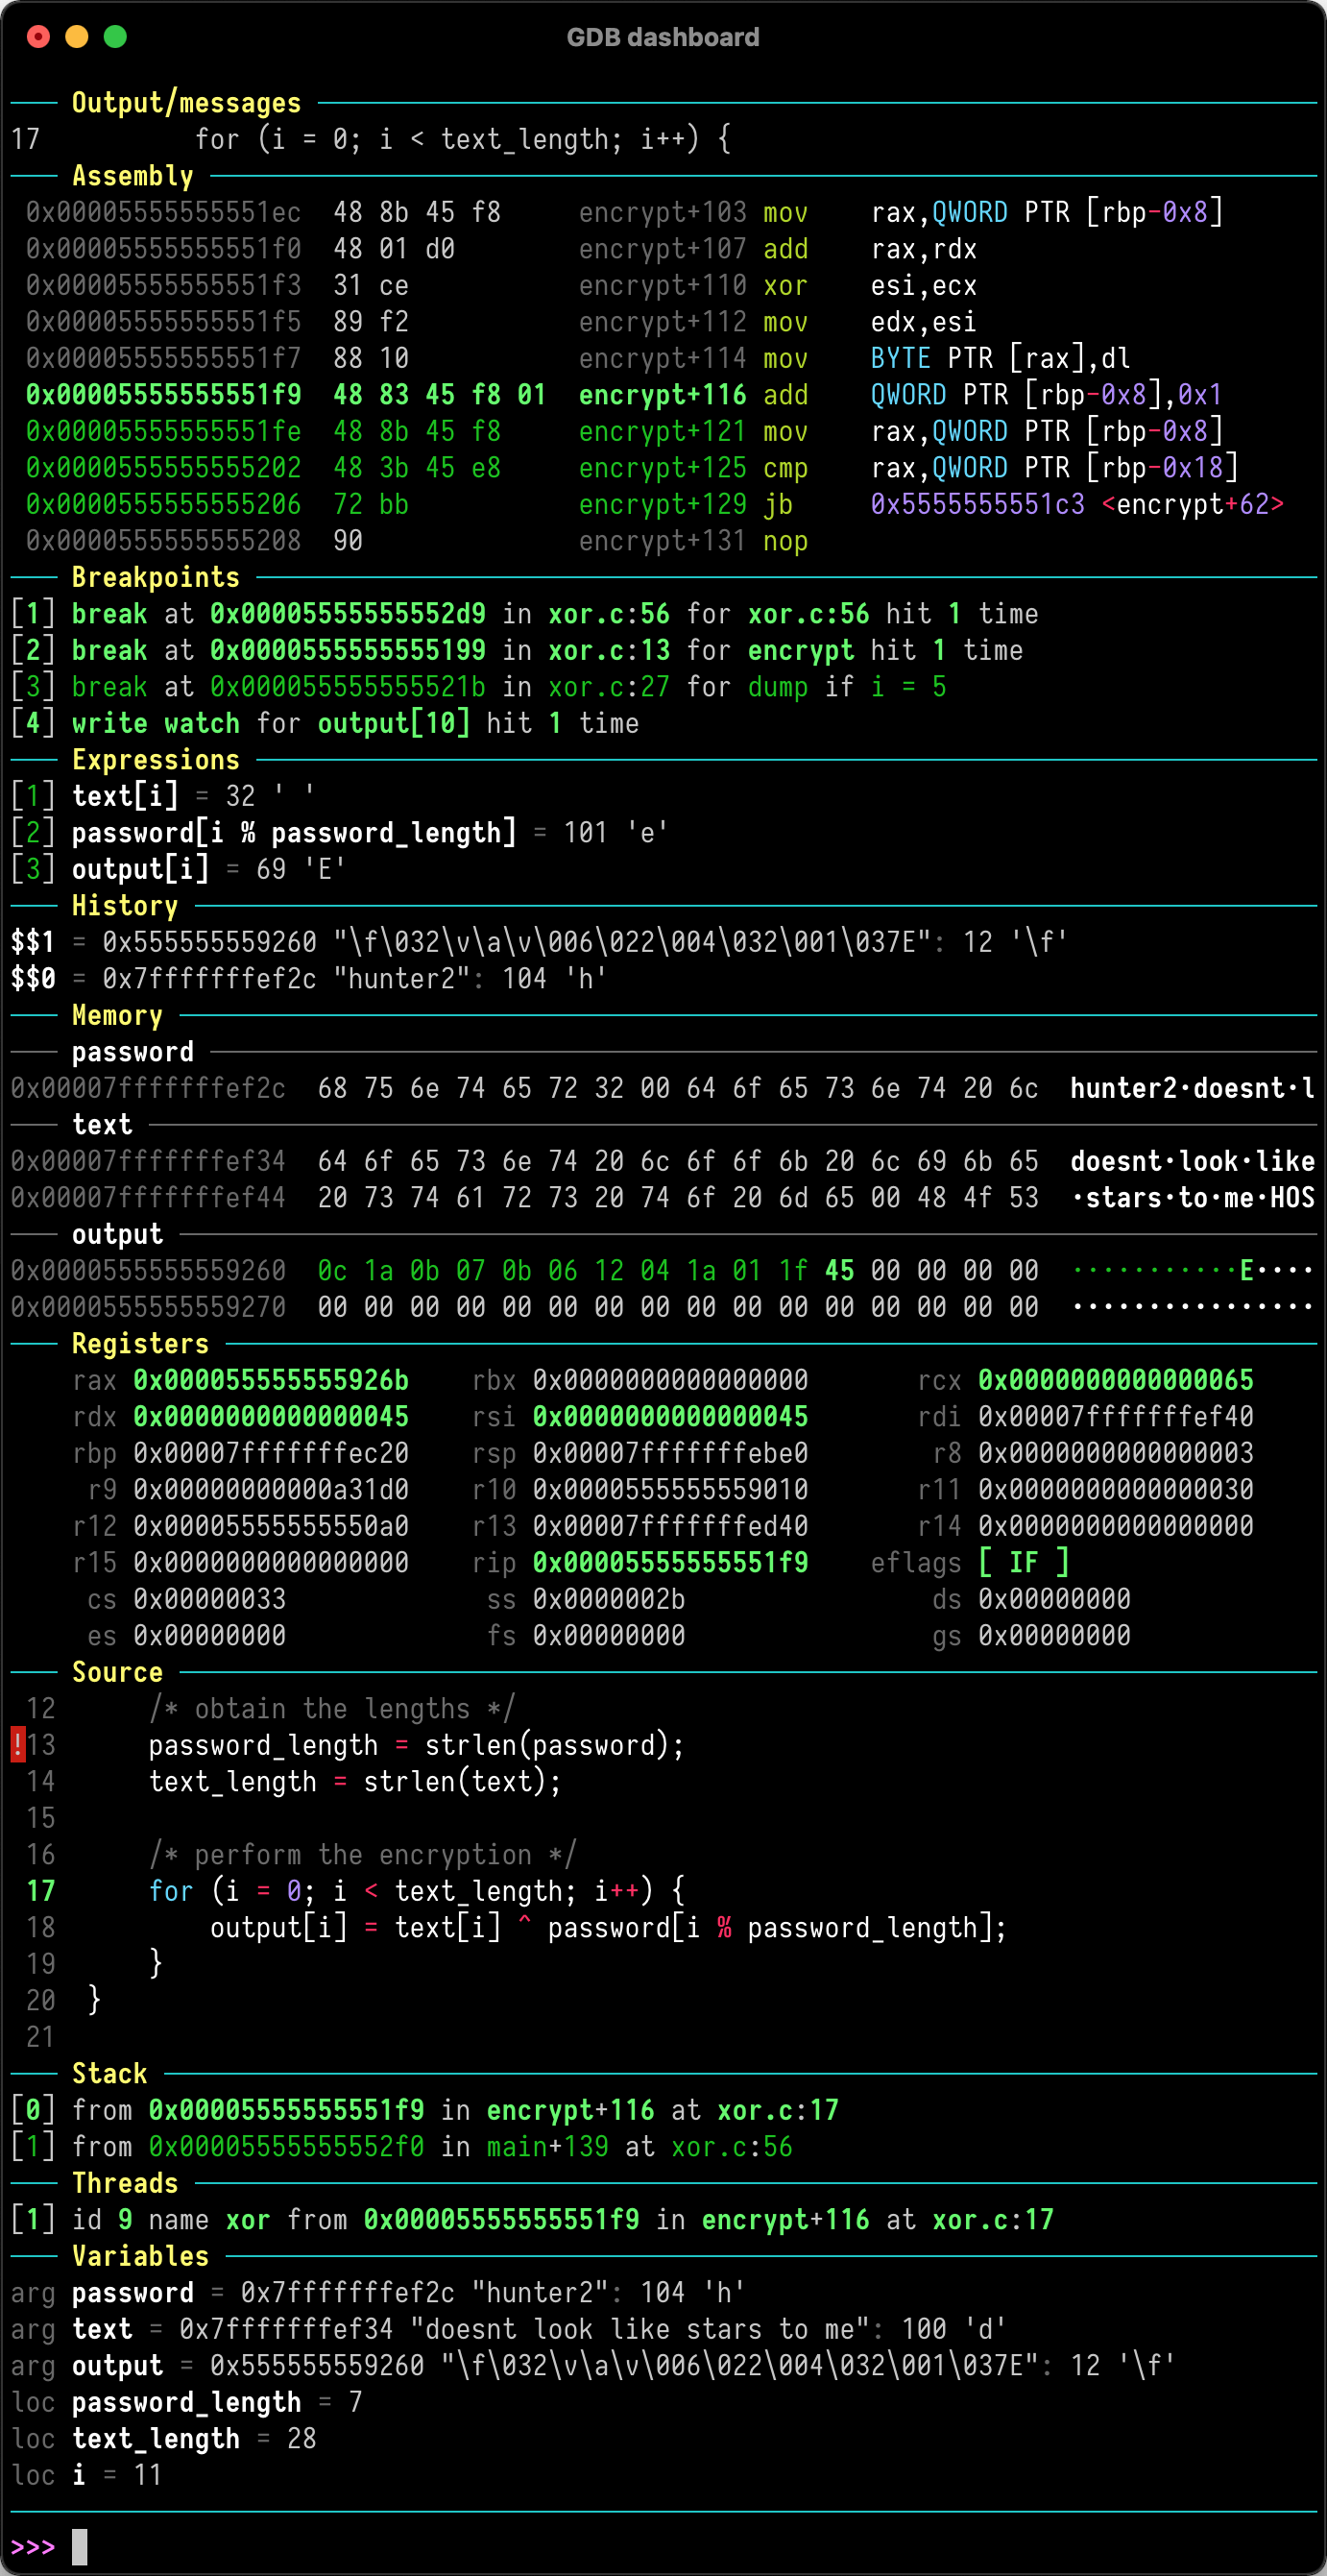
gdb-dashboard
https://github.com/cyrus-and/gdb-dashboard
参考
- Visual Studio Code (VSCode) 之 C/C++ 调试配置详解